

Part 04
Reading an evidence document
What each section of a plot's evidence PDF reports, in the order it appears.
Each plot's evidence document is downloaded from the PDF link in the Evidence column of the Plot register. This page follows the document from its first page to its last.
The finding
The first page opens with the finding in one sentence and a paragraph on what it means. Under a positive finding a further paragraph names the instruments that carried it.
The register shows the reason code in words beside the verdict, and the API
returns it as reason, with the full list in
reasons. On a plot under 4 ha the finding also says the
boundary is smaller than the smallest area a finding is reported at, and that
the record is supporting evidence at that size, so the document says both
what the record supports and why no positive finding was issued. The register
marks that row archive imagery review available, contact us, and the
API lists plot_below_evidence_floor in reasons
after the reason the instruments reached. Every reason is listed in
Reason codes in plain words.
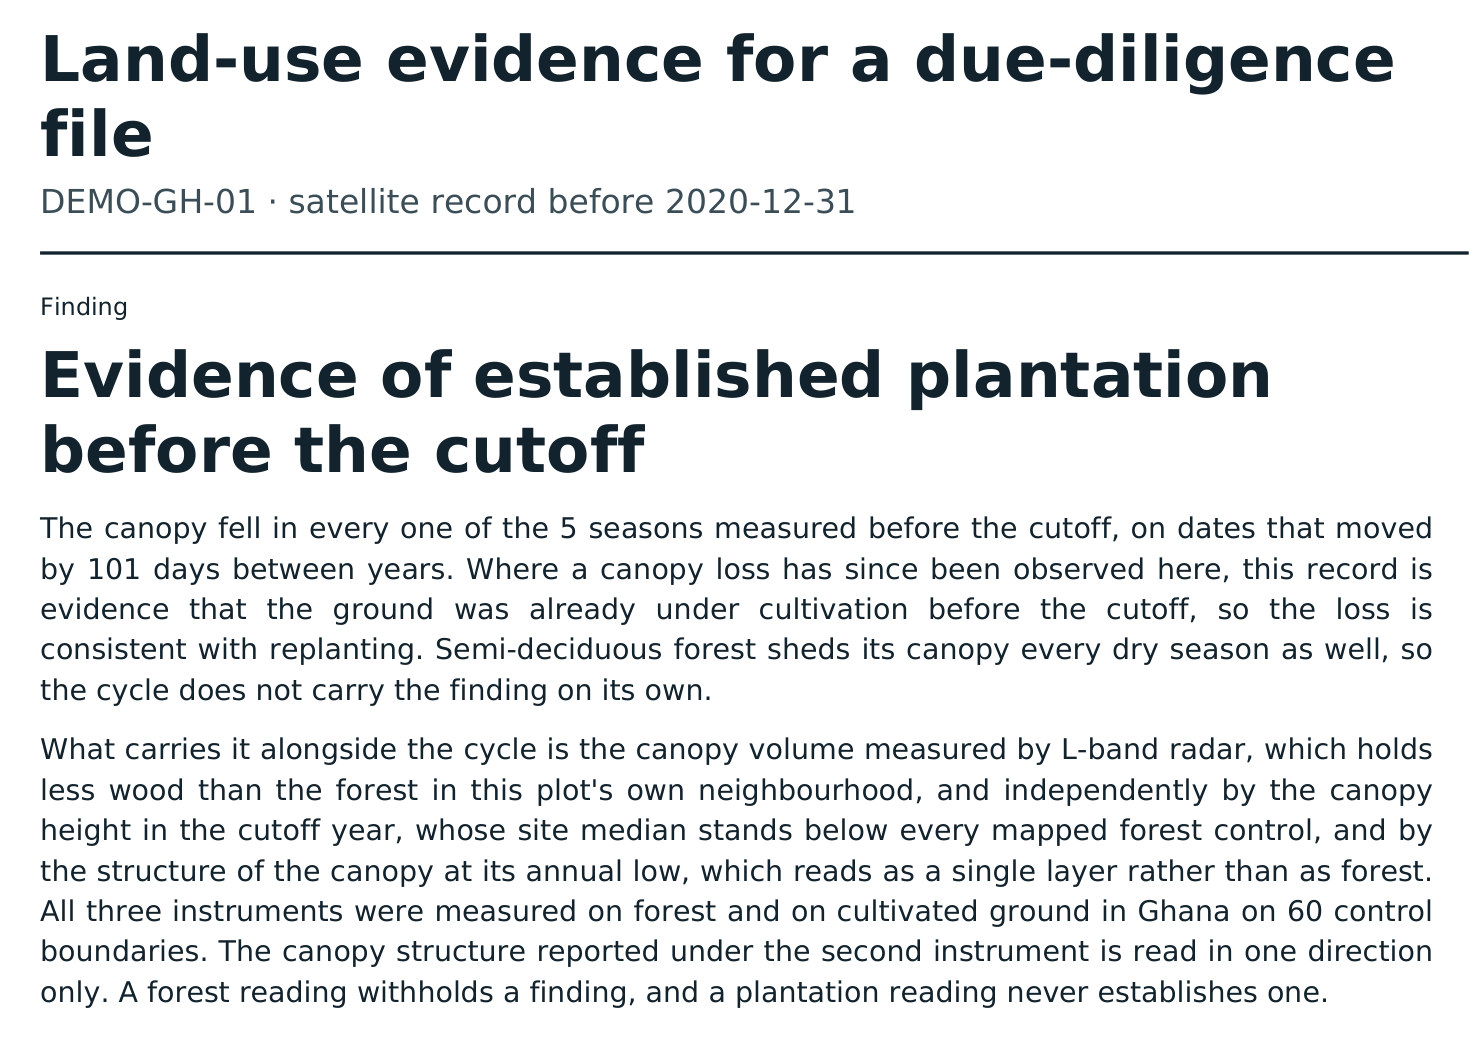
Moist forest loss dated after the cutoff
When present, this box sits directly under the finding. It reports the share and area of the plot where the Landsat record dates the loss of moist forest to 2021 or later, and the years.
Under a positive finding it says the loss is consistent with replanting, because the record reads some old plantations as forest. Under any other finding it marks the part of the plot your risk assessment turns on. It leaves the verdict as it is.
Record too thin
A plot with this verdict carries a box near the top saying the document reaches no finding, and a later section lists the seasons with no usable observation.
The instrument sections
After the scope, the plot details and the pre-cutoff imagery come four sections:
- Primary instrument: L-band canopy volume
- Second instrument: canopy structure from the optical mixture
- Third instrument: canopy height in the cutoff year
- Ground the instruments were read over
Each reports what was measured on the boundary and the instrument's own answer, forest-like or crop-like, or says in words why it could not answer.
The pre-cutoff record gives one row per dry season, with no answer where nobody could look.
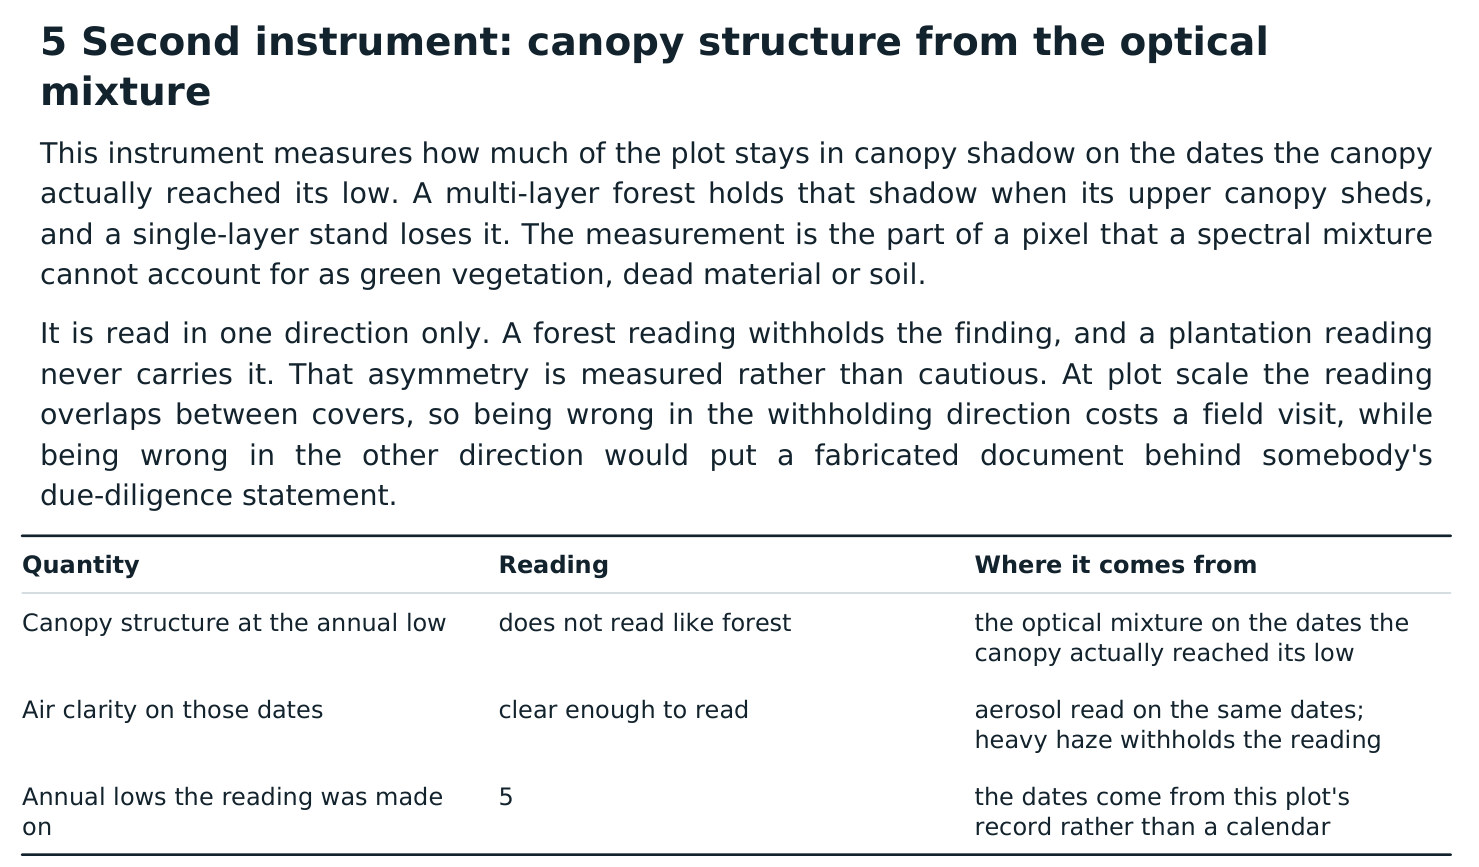
The Landsat history and the building record
The ground in each year since 1990 reports how the Landsat record classes the plot in its first year and at the end of 2020, and the years it dates change on each part. It decides one thing: where the record classes most of the plot as undisturbed moist forest at the end of 2020, a positive finding is withheld.
Buildings on and beside the plot reports whether buildings stood inside the boundary, and separately in a ring around it, in 2016, 2020 and 2023. A building inside the plot in 2020 is evidence the ground was settled before the cutoff.
Both sections sit beside the finding as supporting evidence.
Forest type in 2020 and published crop maps
This section reports how the Commission's 2020 forest-type map classes the plot: primary, naturally regenerating or planted forest, or not forest. Planted forest is forest under the Regulation, so where the map classes most of the plot as planted forest no positive finding is issued, and the reason reads planted forest in 2020. Beside it are published crop maps: the share of the plot with oil palm planted by 2020 and its median planting year, and the share under rubber around 2020 in Southeast Asia. Each figure carries its source.
How this measurement was tested
This section names the control campaign the plot is read against. For a validated region it gives the number of control boundaries, how many forest controls reached a positive finding, how many established crop blocks reached a filable finding (by commodity where measured), the independent reference map and the date.
Where no campaign has been run on that ground, it says so, and states that the settings the instruments are read against were measured on controls in Côte d'Ivoire.
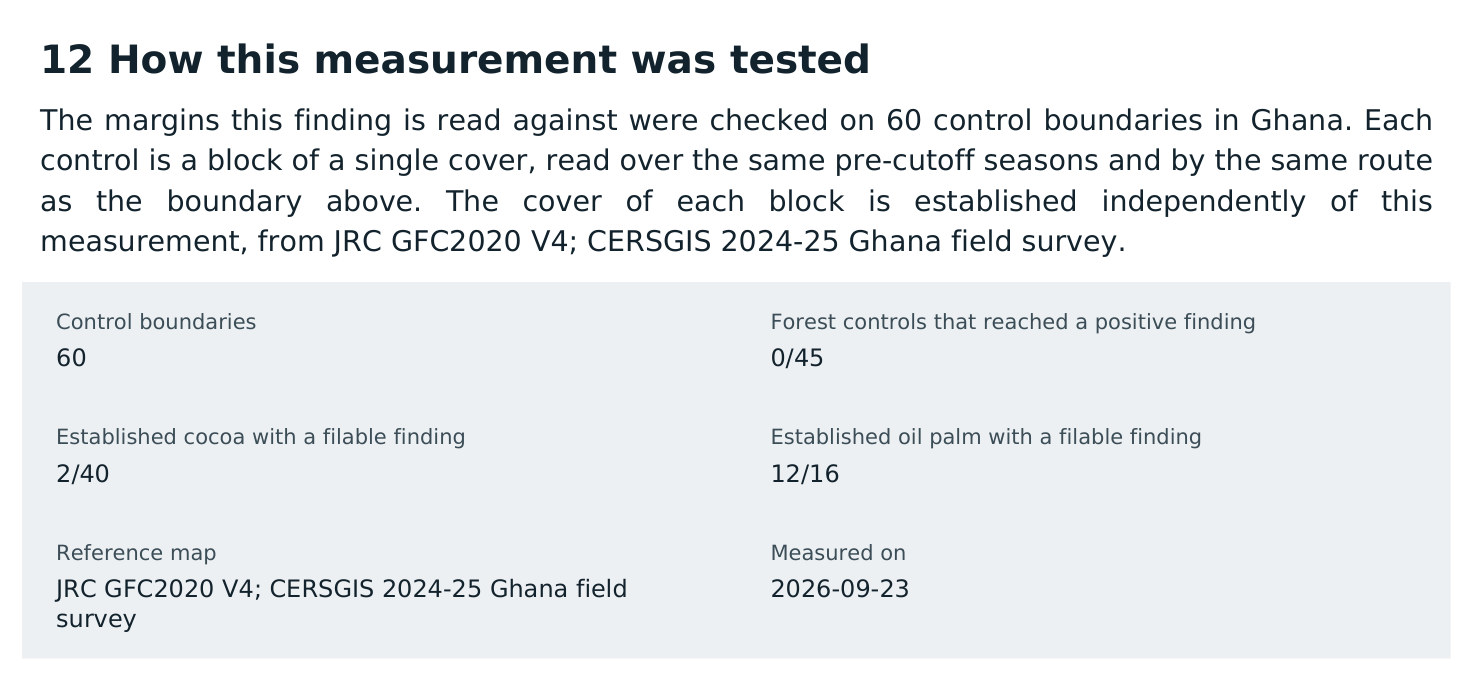
Which campaign a plot is read against
The campaign is chosen from the producer's country, then the plot's country, then the plot's position. A plot near a frontier with no country set can fall between two regions; set the producer's country to receive the regional campaign.
The closing sections
The document ends with where it fits in the Regulation, how to reproduce it from the listed scene identifiers, its limitations, and what may be passed on with it. The API reference describes every field of the evidence object behind the PDF; see API access.