

Part 04
Analytics catalogue
Everything the studio can measure, how each number is produced, and what may be claimed about it.
This is the screen to read before you run anything. It is the only place that states, for every layer, which sensors can carry it, how its number is produced, and what may be claimed about the result.
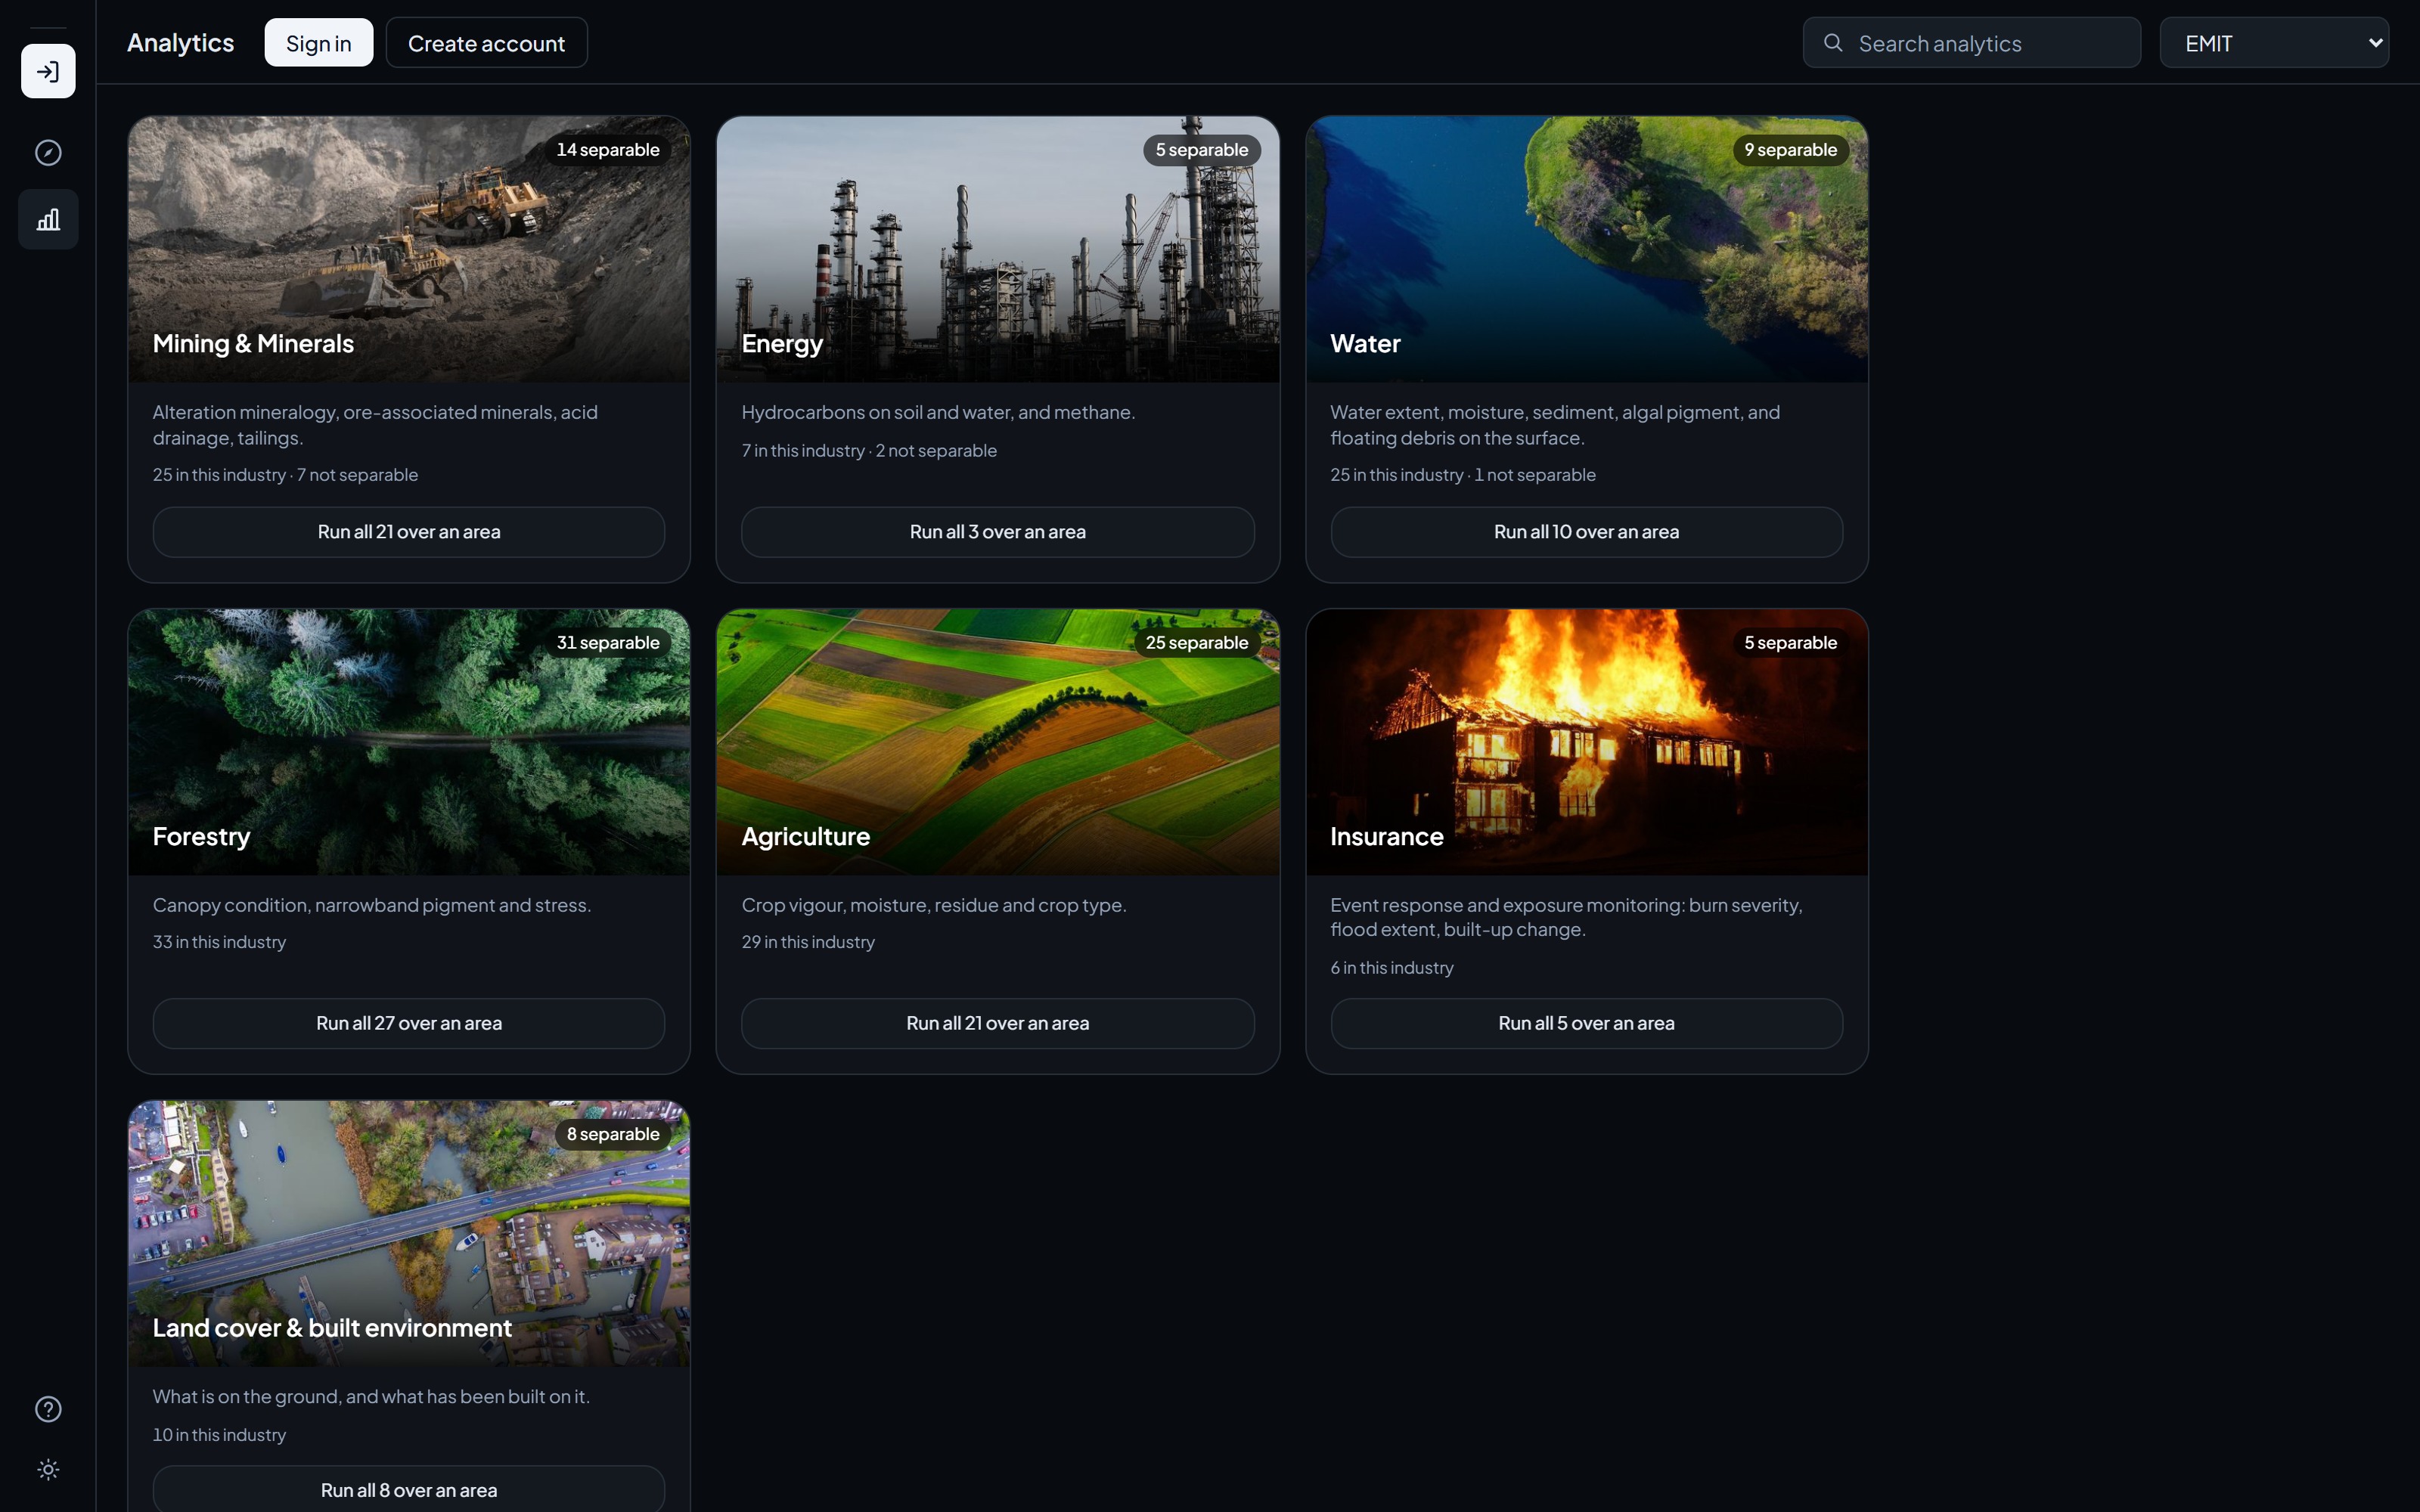
Finding a layer
Analytics
- Industry, in the breadcrumb at the top left. There are seven: mining and minerals, energy, agriculture, forestry, water, insurance, and land and environment. This groups and reorders. Nothing is hidden from you because of it.
- Source, top right. Changing it changes the list, not just the ordering. Minerals need EMIT. Red-edge crop health needs Sentinel-2. Surface temperature comes only from Landsat.
- Search analytics matches the layer name, the description and the plain-language reading of what the layer measures. Searching for "chlorophyll" finds NDRE even though NDRE's own description never uses the word.
- Select all runnable takes everything on the current source that can actually run and carries that selection into the run dialog.
Available, limited, and the two counts
Every card carries an availability verdict for the source you have chosen.
| Verdict | Meaning |
|---|---|
| Available | Runs on this source and is separable from its neighbours. |
| Limited by band width | It computes, but this source cannot separate it from a neighbouring layer. Reading the two rasters as independent detections would be drawing a conclusion the data does not carry. Pyrophyllite at 2167 nm against alunite at 2170 nm is the standard example. |
| Not offered | The source lacks a band the layer needs. The card says which. |
Each industry tile therefore carries two counts rather than one: how many layers run on the current source, and how many of those are separable from each other. On a source with wide bands the second number is the useful one, because it is how many independent things you can actually measure.
Method: how a number is produced
Every entry declares a method. It answers where the number came from, which is a different question from how much you should trust it.
| Method | What it is |
|---|---|
| Band math | Arithmetic on surface reflectance. NDVI, NDWI, clay and iron ratios. |
| Band depth | The depth of an absorption at a known wavelength, after continuum removal. |
| Feature position | Where the minimum of an absorption actually sits, fitted by parabola. |
| Difference | One result subtracted from another over the same ground. |
| Aggregation | A statistic of a layer that already exists, gathered across scenes or across an area. It introduces no new measurement. |
| Temporal composite | Several dates combined into one image. A composite, not an observation. |
| Editorial composite | Several measurements rescaled and combined into one readable number, with weights a person chose. |
| Library fit | Each pixel's spectrum fitted as a mixture of USGS reference spectra plus a featureless background, solved under non-negativity and sum-to-one constraints. |
| Matched filter | A target absorption spectrum fitted against the covariance of the scene itself, on radiance rather than reflectance. |
| Energy balance | A surface energy balance solved from satellite land surface temperature and a daily weather grid, using published constants rather than fitted labels. |
| Fitted model | A statistical model fitted to labelled examples. The only method class in which an accuracy figure can exist at all. |
| Unsupervised | Structure found in the data itself, with no labels and no training. It can say which pixels resemble each other. It cannot say what any of them are. |
Matched filter results are relative to their own scene. The same ground measured in a different acquisition gives a different value, and the sensitivity is a per-pixel property rather than a constant. The filter also responds to anything shaped like the target, which is why a detection layer of this kind ships with a false-positive risk layer beside it.
Energy balance carries the model's assumptions as well as the measurement's error. Cloud contamination of the thermal band biases it high, and irrigated ground inside dry surroundings reads low.
Posture: what may be claimed
The posture is the most useful thing on a card. It states what the number licenses you to say. There are seven, and they are not a quality ranking. Two entries with no accuracy figure can have none for opposite reasons.
| Posture | What it means |
|---|---|
| Deterministic | Exact and repeatable. The absorption is measured at a known wavelength, and attributing it to a material is a separate step. The caveats list what else absorbs there. No accuracy figure exists, because the number is the arithmetic. |
| Screening | Applied as published, without local recalibration. Patterns are comparable within a scene. Treat absolute values as indicative until they have been checked against your own samples. |
| Judgement | A summary score whose weights a person chose for readability. No accuracy figure can exist for it, which is not the same as it being exact. No dataset would settle whether the weights are right, because there is no ground truth for a summary score. Use it to rank and to sort, and read the layers underneath it before acting. |
| Regional | An accuracy is quoted only inside calibrated regions. Elsewhere the model runs unchanged and reports no figure, because one province's accuracy says nothing about another's. See Region calibration. |
| Local fit | A model we fitted, whose figures were measured in the one area and on the one acquisition date it was fitted on. Both are named on the card. The reference was another map derived from the same imagery, so the card reports an agreement between two maps rather than an accuracy against anything observed on the ground. Outside that area the model still runs, and it is extrapolating. |
| Benchmark fit | A model we fitted, measured on somebody else's published benchmark against expert interpretation rather than ground observation. The pooled figure hides a wide per-acquisition spread, so the card gives the range as well as the middle. |
| Not scored | Unsupervised clustering. There are no reference labels, so precision and recall are undefined. |
Limits and validation
Each card has a collapsed disclosure holding the method in full, what the layer is blind to, what else produces the same reading, and its validation status. The card states what the layer delivers; the limits sit one click away, complete and unedited. Exports and printed reports carry that text expanded, so a document leaving the studio never loses it.
What a plan unlocks
Tier is decided by method, not by how interesting a layer is. Anything whose number is arithmetic on public pixels is on every plan. Anything that carries our judgement or our fitted model needs a paid plan.
| Tier | Methods |
|---|---|
| Every plan | Band math, band depth, feature position, difference, aggregation and temporal composite. |
| Paid plan | Editorial composite, covering alteration intensity, acid drainage, rare earths and forest health. Library fit, covering mineralogy and unmixing. Fitted model, covering crop type and land cover. Unsupervised clustering. |
There is no per-run charge on either tier and no order to place. A refusal names the blocked layers and the plan that unlocks them.