Part 07
Comparing two dates
Two analyses of one area, subtracted, with the numbers that make the difference defensible.
Reach the change screen from Change on a result, from an area's Compare tab, or from the rail. It only ever compares two analyses of the same ground, and it is strict about what counts as the same ground.
Picking a comparable pair
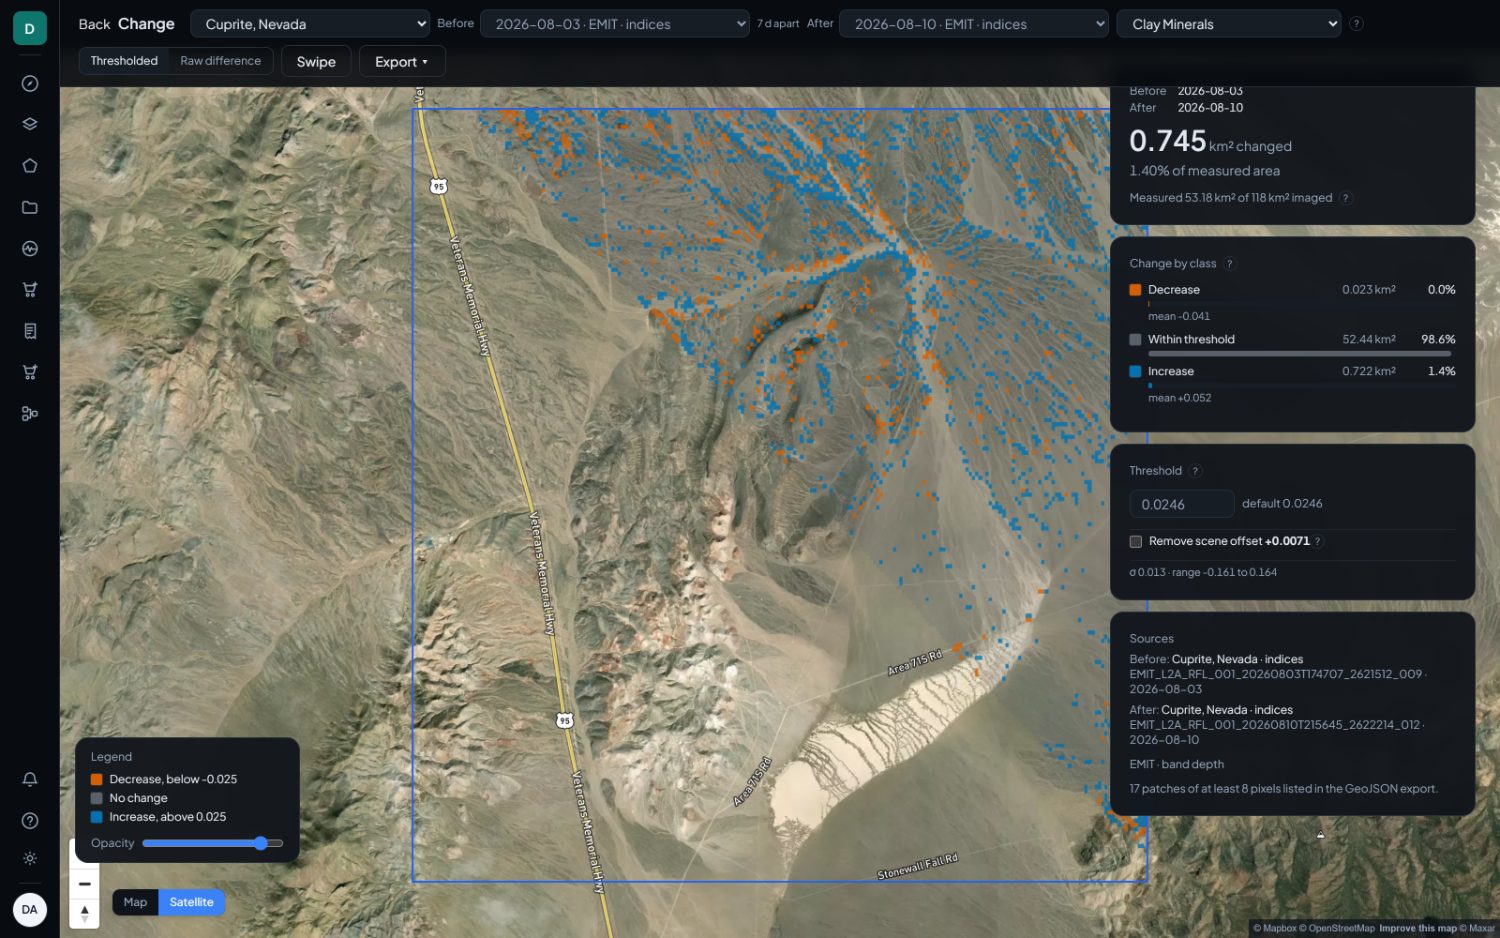
The first dropdown lists comparable sets. A set is grouped by area, by sensor and by engine, because a comparison across any of the three is refused. Two sensors do not read the same number over the same ground, and two engines are two different measurements.
One area can therefore legitimately appear more than once in that list, labelled with its sensor and engine. Areas that cannot yield a comparison are listed with the reason: either only one analysis exists, or every analysis is a re-run over a single acquisition, which is a different problem with a different fix.
Then pick Before and After. The gap between the two acquisitions is printed between them.
Choosing what to compare
The layer dropdown offers only layers that both analyses carry. A class layer
is marked (classes).
Under a Derived heading you may also see Burn severity. It appears only when both analyses carry NBR, and it classifies their difference on published dNBR thresholds. It is grouped apart because it is not a layer either analysis holds.
Modes
| Layer kind | Mode | What it draws |
|---|---|---|
| Continuous | Thresholded | Only pixels whose change exceeds the threshold, coloured by direction. This is the default and the one to report from. |
| Raw difference | The signed difference everywhere, on a ramp. Use it to check whether the threshold sits in a sensible place. | |
| Classified | Became | Coloured by what each pixel became. |
| Was | Coloured by what each pixel was. |
Burn severity has no mode, because the severity classes arrive fixed with the tile.
Reading the numbers
- Area changed, in km², and as a share of the measured area.
- Measured X of Y km² imaged. These are two different areas. Every percentage is of the measured one, never of the imaged one.
- Change by class gives increase, decrease and what stayed within threshold, each with its area, its share and its mean. On a classified comparison this becomes a transition table: which class became which, with the area of each transition.
- Threshold, shown with the default it was derived from and editable. Raising it asks a stricter question.
- Remove scene offset. Two passes of one sensor can sit at slightly different levels for reasons that have nothing to do with the ground. The offset is stated so you can decide whether to take it out, rather than being removed silently.
- Sigma and range of the difference, which is what the default threshold is derived from.
- Sources gives both granule identifiers in full, and both dates.
- Patches counts contiguous runs of changed pixels above the minimum cluster size, listed individually in the GeoJSON export. A patch count is usually more useful than an area when you are deciding where to send somebody.
Swipe and export
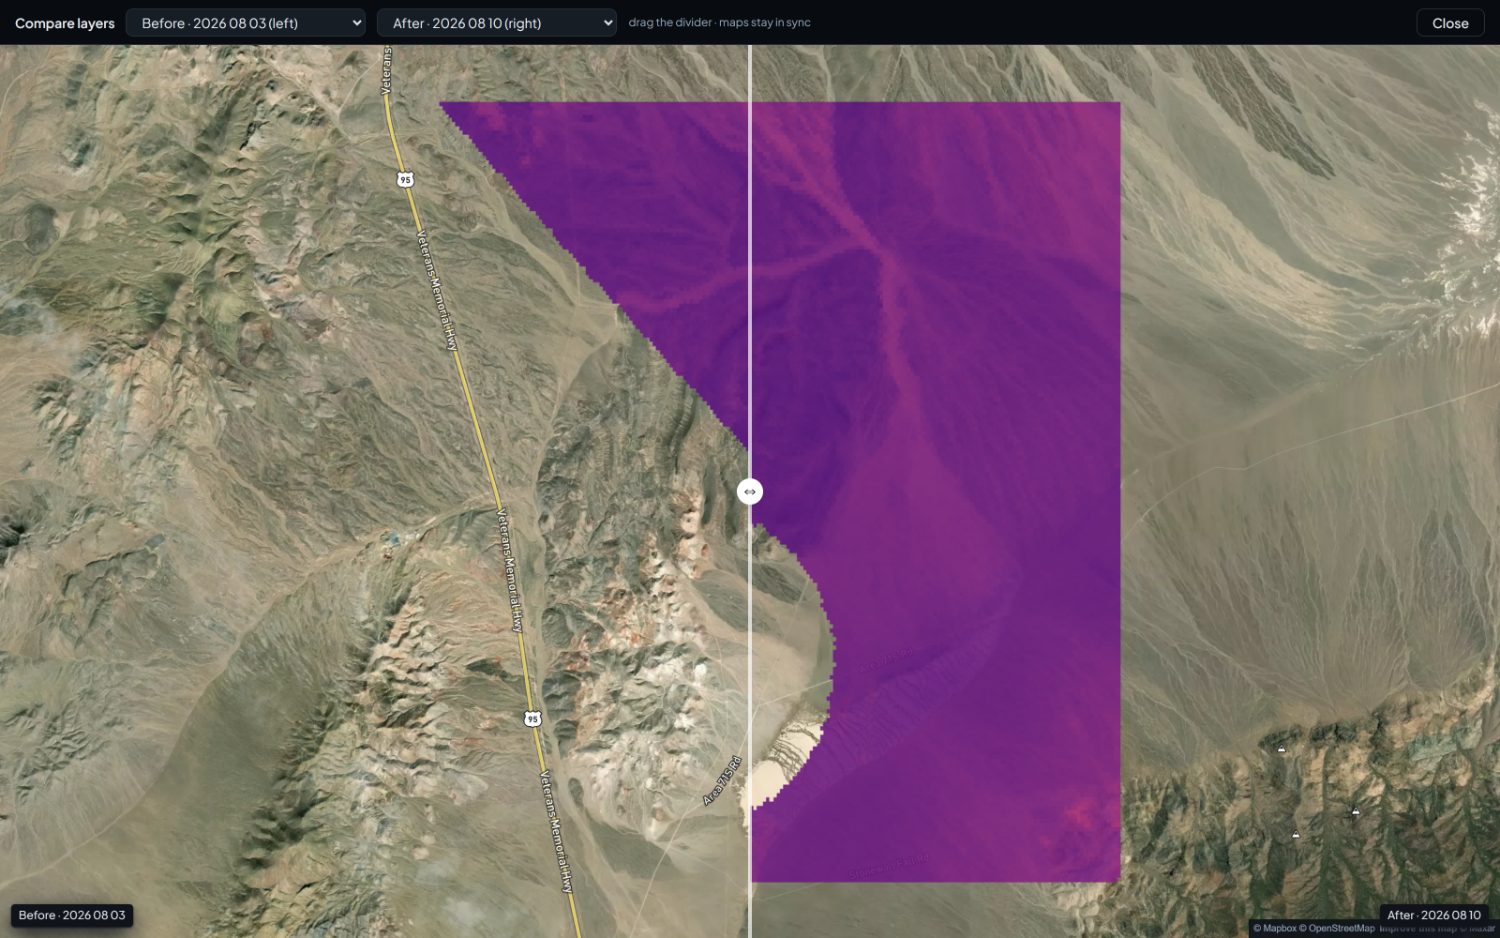
Swipe puts the two dates side by side under a draggable divider on one camera. It is the fastest way to show that a change is real rather than an artefact of the colour ramp.
Export takes the comparison out as a raster or as the patch vectors. It is not offered on burn severity, and it is not offered on a refused pair.